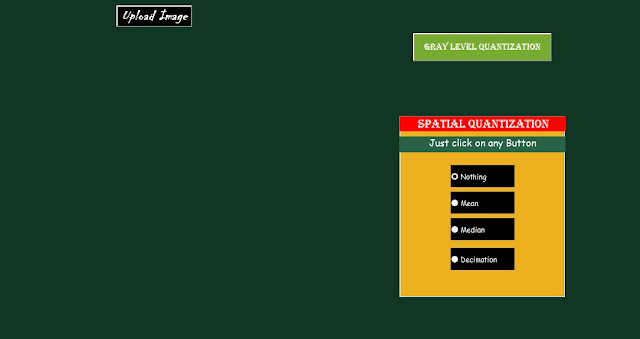
Description: This
MATLAB code does Image quantization, both in frequency domain as well as in
spatial domain. Quantization done are:
1. Gray
Level Quantization
2. Mean
Filter
3. Median
Filter
4. Decimation
Filter


MATLAB
Code
function
varargout = assign(varargin)
% Begin initialization code - DO NOT EDIT
gui_Singleton = 1;
gui_State = struct('gui_Name', mfilename, ...
'gui_Singleton', gui_Singleton, ...
'gui_OpeningFcn', @assign_OpeningFcn, ...
'gui_OutputFcn', @assign_OutputFcn, ...
'gui_LayoutFcn', [] , ...
'gui_Callback', []);
if nargin &&
ischar(varargin{1})
gui_State.gui_Callback = str2func(varargin{1});
end
if nargout
[varargout{1:nargout}] = gui_mainfcn(gui_State, varargin{:});
else
gui_mainfcn(gui_State, varargin{:});
end
% End initialization code - DO NOT EDIT
% --- Executes just before assign is made visible.
function
assign_OpeningFcn(hObject, eventdata, handles, varargin)
% This function has no output args, see OutputFcn.
% hObject handle to figure
% eventdata reserved - to be
defined in a future version of MATLAB
% handles structure with
handles and user data (see GUIDATA)
% varargin command line
arguments to assign (see VARARGIN)
% Choose default command line output for assign
handles.output = hObject;
% Update handles structure
guidata(hObject, handles);
% --- Outputs from this function are returned to the command line.
function
varargout = assign_OutputFcn(hObject, eventdata, handles)
% varargout cell array for
returning output args (see VARARGOUT);
% hObject handle to figure
% eventdata reserved - to be
defined in a future version of MATLAB
% handles structure with
handles and user data (see GUIDATA)
% Get default command line output from handles structure
varargout{1} = handles.output;
function
uploadImage_Callback(hObject, eventdata, handles)
axes(handles.mainAxes);
imshow('image.jpg');
function
grayLevel_Callback(hObject, eventdata, handles)
A=imread('image.jpg');
Image = rgb2gray(A);
Show = {'Enter desired Gray Level'};
boxTitle = 'Input Gray Level';
numLines = 1;
input = inputdlg(Show,boxTitle,numLines);
x=256-(256/str2double(input));
mask=de2bi(x,8);
C=zeros(size(Image,1), size(Image,2));
for i=1:size(Image,1);
for j=1:size(Image,2);
a=de2bi(Image(i,j),8);
C(i,j)=bi2de(a&mask);
end
end
resultImage=uint8(C);
figure
subplot(1,2,1), imshow(Image)
subplot(1,2,2), imshow(resultImage);
truesize
function MEAN()
A=imread('image.jpg');
Image = rgb2gray(A);
B=[1/9,1/9,1/9;
1/9,1/9,1/9;
1/9,1/9,1/9];
r=round(size(Image,1)/3);
c=round(size(Image,2)/3);
C=zeros(r,c);
p=1;
for i=1:3:size(Image,1)-2;
q=1;
for j=1:3:size(Image,2)-2;
sum=0;
for a=1:3;
for b=1:3;
sum=sum+Image(i+a-1,j+b-1)*B(a,b);
end
end
C(p,q)=sum;
q=q+1;
end
p=p+1;
end
resultImage=uint8(C);
figure
subplot(1,2,1), imshow(Image);
subplot(1,2,2), imshow(resultImage);
truesize
function MEDIAN()
A=imread('image.jpg');
Image = rgb2gray(A);
B=[1/9,1/9,1/9;
1/9,1/9,1/9;
1/9,1/9,1/9];
r=round(size(Image,1)/3);
c=round(size(Image,2)/3);
C=zeros(r,c);
p=1;
for i=1:3:size(Image,1)-2;
q=1;
for j=1:3:size(Image,2)-2;
sum=0;
for a=1:3;
for b=1:3;
B(a,b)=Image(i+a-1,j+b-1);
end
end
D=reshape(B',1,9);
E=sort(D);
F=D(1,5);
C(p,q)=F;
q=q+1;
end
p=p+1;
end
resultImage=uint8(C);
figure
subplot(1,2,1), imshow(Image);
subplot(1,2,2), imshow(resultImage);
truesize
function DECIMATION()
A=imread('image.jpg');
Image = rgb2gray(A);
B=[1/9,1/9,1/9;
1/9,1/9,1/9;
1/9,1/9,1/9];
r=round(size(Image,1)/3);
c=round(size(Image,2)/3);
C=zeros(r,c);
p=1;
for i=1:6:size(Image,1)-2;
q=1;
for j=1:6:size(Image,2)-2;
sum=0;
for a=1:3;
for b=1:3;
C(p+a-1,q+b-1)=Image(i+a-1,j+b-1);
end
end
q=q+3;
end
p=p+3;
end
resultImage=uint8(C);
figure
subplot(1,2,1), imshow(Image);
subplot(1,2,2), imshow(resultImage);
truesize
function buttonGroup_SelectionChangeFcn(hObject, eventdata, handles)
if(strcmp(get(eventdata.NewValue, 'Tag'),'meanButton'))
MEAN();
else if (strcmp(get(eventdata.NewValue, 'Tag'),'medianButton'))
MEDIAN();
else if (strcmp(get(eventdata.NewValue, 'Tag'),'decimationButton'))
DECIMATION();
end
end
end
 01:52
01:52

No comments
Post a Comment